Announcement

Collapse
No announcement yet.

Some trouble with current cost!

Collapse
X
 
  • Filter
  • Time
  • Show
Clear All
new posts

    Some trouble with current cost!

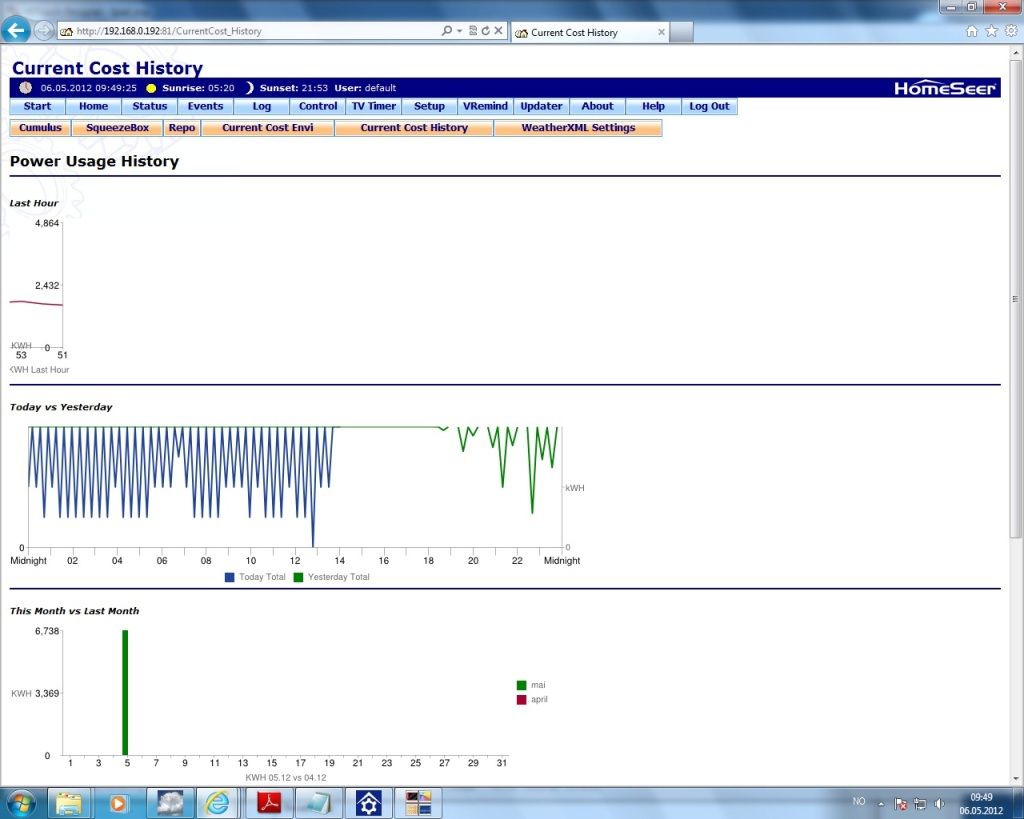
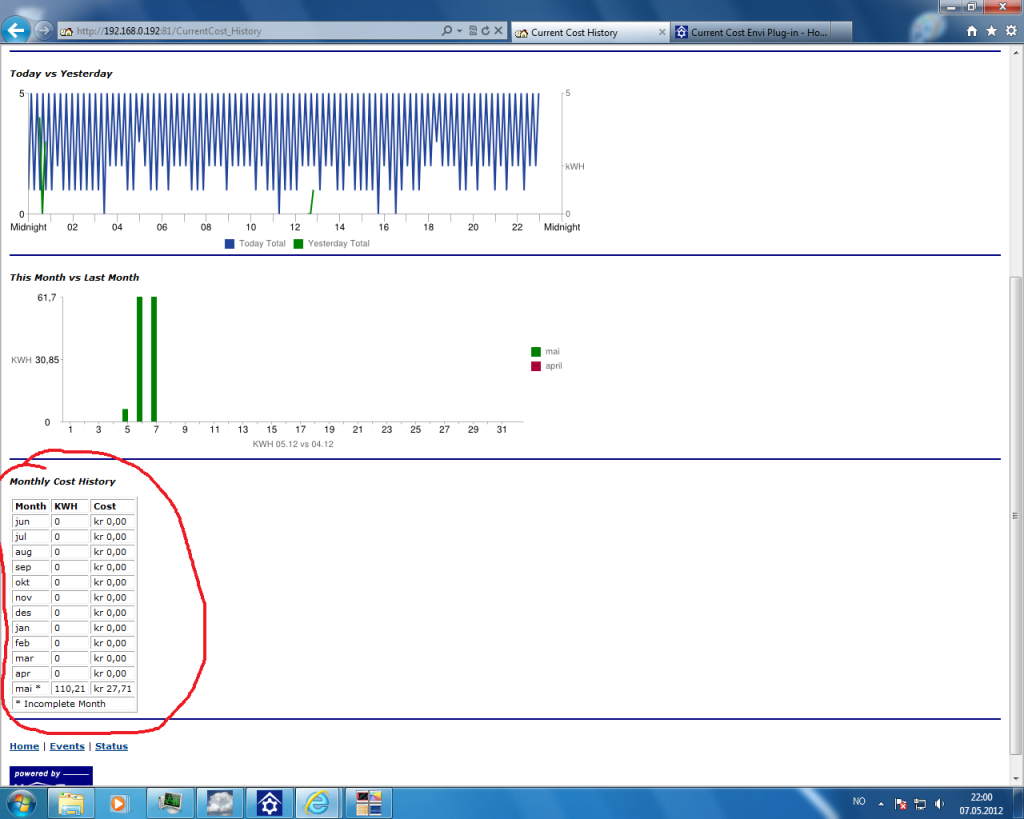
    My grafs dos`nt seems to work so good
    Here is a picture of the screen.
    I also have some trouble with the temp. it yust show 0 in the status view..
    Hope someone can help me

    The current cost version is 1.0.0.57
    hs version 2.5.0.49
    and i use a envir http://currentcost.com/product-envir.html

    Last edited by Mrtiger; May 6, 2012, 03:25 AM.

    #2
    The zero issue is a bug. Your graphs look like you only have one day of data. So give it a while and see if they start looking more like graphs. Your usage looks odd to me though.
    💁‍♂️ Support & Customer Service 🙋‍♂️ Sales Questions 🛒 Shop HomeSeer Products

    Comment


      #3
      Originally posted by Rupp View Post
      The zero issue is a bug. Your graphs look like you only have one day of data. So give it a while and see if they start looking more like graphs. Your usage looks odd to me though.
      ok, but i must say that the last hour graf looks little strange?
      It should be normal since i have data from yesterdag(did install it yesterday)
      And how do i change the cost rate, i see that is 0.13 but i cant change it?(under setup - interface - current cost - config)
      Last edited by Mrtiger; May 6, 2012, 02:02 PM.

      Comment


        #4
        Is it yust me who has this problem

        Comment


          #5
          I have this problem too, Only 1 day of data, and also the temp sensor does not work, might that be the problem?

          Comment


            #6
            Originally posted by genoenhuis View Post
            I have this problem too, Only 1 day of data, and also the temp sensor does not work, might that be the problem?
            What version do you have?
            I think i have more than 1 day of data...But something strange is going on

            By the way, were can i find the logfile?

            Is it possible to use the Monthly cost history(marked as red in the picture) in hstouch

            Last edited by Mrtiger; May 7, 2012, 03:29 PM.

            Comment


              #7
              the version i use is 1.0.0.57, tried to find the beta 1.0.0.60 but i cant find it anymore.
              Homeseerpro version 2.5.052

              Comment


                #8
                Originally posted by genoenhuis View Post
                the version i use is 1.0.0.57, tried to find the beta 1.0.0.60 but i cant find it anymore.
                Homeseerpro version 2.5.052
                ftp://ftp.homeseer.com/updates/Beta/...T_1_0_0_60.zip
                Zwave = Z-Stick, 3xHSM100� 7xACT ZDM230, 1xEverspring SM103, 2xACT HomePro ZRP210.
                X10 = CM12U, 2xAM12, 1xAW10, 1 x TM13U, 1xMS13, 2xHR10, 2xSS13
                Other Hardware = ADI Ocelot + secu16, Global Cache GC100, RFXtrx433, 3 x Foscams.
                Plugings = RFXcom, ActiveBackup, Applied Digital Ocelot, BLDeviceMatrix, BLGarbage, BLLAN, Current Cost, Global Cache GC100,HSTouch Android, HSTouch Server, HSTouch Server Unlimited, NetCAM, PowerTrigger, SageWebcamXP, SqueezeBox, X10 CM11A/CM12U.
                Scripts =
                Various

                Comment


                  #9
                  This version dident help me

                  Comment


                    #10
                    Your graphs show data albeit odd looking. Is something in your home using power in spikes? If not you may want to look at the antenna icon and make sure you have a good connection to the transmitter.
                    💁‍♂️ Support & Customer Service 🙋‍♂️ Sales Questions 🛒 Shop HomeSeer Products

                    Comment


                      #11
                      Originally posted by Rupp View Post
                      Your graphs show data albeit odd looking. Is something in your home using power in spikes? If not you may want to look at the antenna icon and make sure you have a good connection to the transmitter.
                      The antenna icon is high.
                      If i run the envir with some of the other programs thats come with the item, then i dont have any spikes.
                      I did look true some of the post here and i can see that someone else did have this problem.(see link)
                      http://board.homeseer.com/showthread.php?t=149343

                      Comment


                        #12
                        I have no idea what is causing this. It looks like interference of some type though. If the other software isn't showing this, then maybe try installing the plugin and deleting all files. Then reinstall. You could also review the data coming through the com port to see if it is in fact spiky as shown.
                        💁‍♂️ Support & Customer Service 🙋‍♂️ Sales Questions 🛒 Shop HomeSeer Products

                        Comment


                          #13
                          Originally posted by Rupp View Post
                          You could also review the data coming through the com port to see if it is in fact spiky as shown.
                          hmm, how can i do that?

                          Comment


                            #14
                            Originally posted by Rupp View Post
                            I have no idea what is causing this. It looks like interference of some type though. If the other software isn't showing this, then maybe try installing the plugin and deleting all files. Then reinstall. You could also review the data coming through the com port to see if it is in fact spiky as shown.
                            Unless it was fixed I think the problem in the thread posted is much more likely problem, comma decimal seperator rather than a decimal point is going to create all sorts of misery with Google charts which expect a comma as a data seperator.

                            Comment


                              #15
                              Originally posted by Mrtiger View Post
                              hmm, how can i do that?
                              If you go to the Current Cost website there is an application called C2 terminal that you can use for this.

                              Comment

                              Working...
                              X